HowGood is an independent research company and SaaS data platform with the world's largest database on food product sustainability. With more than 90,000 on-farm emissions factors for food ingredients, HowGood helps leading brands, retailers, suppliers and restaurants to measure, manage, and communicate their environmental and social impact.
Water Smart
Does this product have a low blue water footprint?
What does the Water Smart attribute measure?
HowGood’s Water Smart attribute recognizes food products that are less of a stress on the water supply in the regions where their ingredients are produced. It is based on the Blue Water Usage metric which takes into account both the blue water used in growing the ingredients of a product and the blue water scarcity in those respective regions. In order for a product to receive the Water Smart attribute, its total blue water impact must be better than 80% of all products assessed by HowGood.
How long does a product qualify for the Water Smart attribute?
Products that qualify for Water Smart receive access to the attribute for public-facing communications for one year. At the end of the annual contract, products must be reassessed based on the current industry benchmark to re-qualify.
What does the Water Smart attribute mean for consumers?
The Water Smart attribute provides consumers with a clear indicator of a product’s impact on freshwater resources. It’s easy-to-digest and guides consumers toward more sustainable purchases. The Water Smart attribute empowers shoppers to make decisions that are in line with their values and preferences. By purchasing Water Smart products, consumers can take a step toward reducing their water footprint.
What is HowGood’s research methodology for calculating blue water usage?
Blue Water Usage is a measure of the amount of blue water appropriation, adjusted for the degree of blue water scarcity in the location where the ingredient is grown. Blue water appropriation refers to the withdrawal and use of water from freshwater lakes, rivers and aquifers for human activities.
The Blue Water Usage metric has two components:
1. Blue Water Footprint: a crop-and-location-specific blue water footprint (the amount of blue water that a given crop requires in a given location).
2. Blue Water Scarcity: a location-specific blue water scarcity assessment (the degree of blue water scarcity in a given location), which provides the geographic sustainability component.
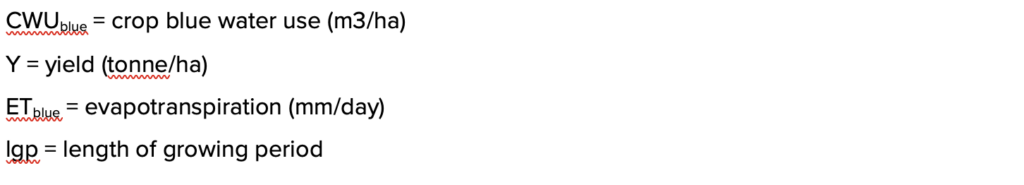
For a crop, the Blue Water Footprint (WFblue) is calculated as follows (Hoekstra et al. 2011, p. 41):
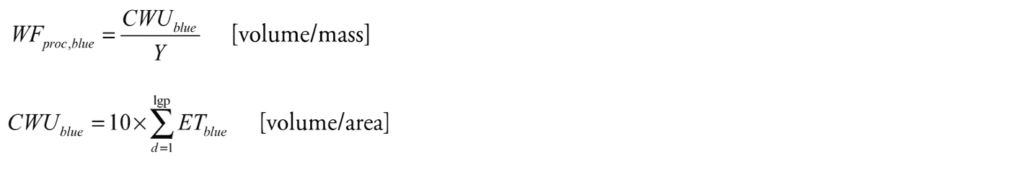
Where:
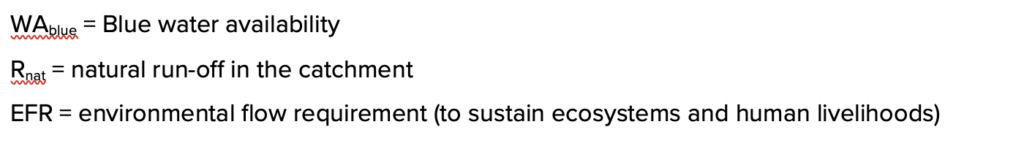
The Blue Water Scarcity (WSblue) is usually calculated at catchment level and provides an estimate of how much of the available blue water has been already appropriated by human activities within a certain geographical area. It is calculated as follows (Hoekstra et al. 2011, p. 82-85):
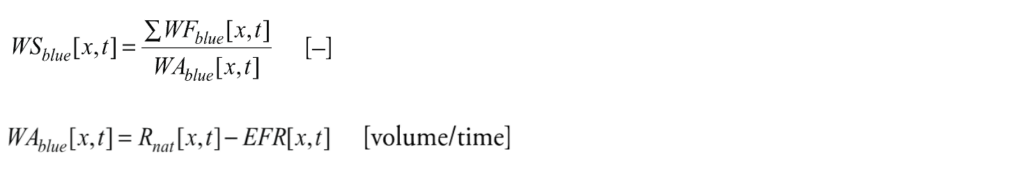
Where:
If:
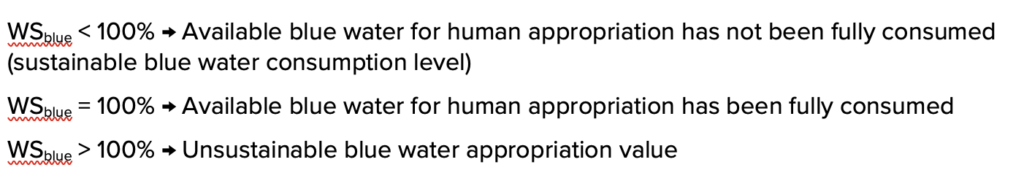
Finally, the Blue Water Usage metric is calculated as follows:
Blue Water Usage = Blue water footprint * Blue water scarcity [L/kg]
The Blue Water Usage impact spectrum divides the blue water impact values of the ingredients in HowGood’s database into deciles. If an ingredient has an impact lower than 90% of all ingredients in our database, it will score a 10. If it has an impact lower than only 10% of all ingredients in our database, it will score a 1.
What data sources does HowGood use to assess blue water impact?
HowGood draws on the values for blue water usage in the dataset provided by Mekonnen & Hoekstra (2011, 2012), while the blue water scarcity values are extrapolated from the geographical database provided by Mekonnen & Hoekstra (2016). For crops and locations where no current data exists, HowGood uses supplementary studies and relevant LCAs from proxy locations where environmental conditions and farming methods are deemed as similar.
Data Sources:
Mekonnen, M.M. & Hoekstra, A.Y. (2011) The green, blue and grey water footprint of crops and derived crop products, Hydrology and Earth System Sciences, 15(5): 1577-1600. https://waterfootprint.org/en/resources/waterstat/product-water-footprint-statistics/
Hoekstra, A.Y., Chapagain, A.K., Aldaya, M.M. and Mekonnen, M.M. (2009). The water footprint assessment manual. Earthscan, London: Water footprint network. https://waterfootprint.org/en/resources/publications/water-footprint-assessment-manual/
Mekonnen, M.M. & Hoekstra, A.Y. (2012) A global assessment of the water footprint of farm animal products, Ecosystems, 15(3): 401–415 https://waterfootprint.org/en/resources/waterstat/product-water-footprint-statistics/
Mekonnen, M.M. & Hoekstra, A.Y. (2016) Four billion people facing severe water scarcity, Science Advances, 2(2): e1500323 https://waterfootprint.org/en/resources/waterstat/water-scarcity-statistics/
Additional sources used for the scientific assessment of the metric methodology, data quality assessment and proxy identification include:
- The Food and Agriculture Organization of the United States
- UNESCO Institute for Water Education
- The International Journal of Life Cycle Assessment
- Water Resources Management
- Environmental Science & Technology Water (Journal)
- Nature Resources (Journal)
- Water Resources and Industry Agriculture (Journal)
- Sustainability (Journal)
- Advances in Water Resource Hydrology and Earth System Sciences Ecosystems (Journal)
- Science Advances (Journal)
- University of Twente
- University of Regina
What is HowGood’s research methodology?
HowGood has 15 years of research on global food supply chains. The team consolidates and analyzes findings from over 550 accredited data sources and certifications. These include a range of resources such as peer reviewed Life-Cycle-Assessment studies, journal articles, academic conference proceedings and texts, aggregated commercial databases, targeted industry studies, NGO research, and government publications. HowGood is dedicated to not only employing the most industry-recognized methodologies but also ensuring that the latest scientific research is incorporated. Metrics and impact assessments are updated accordingly, on an ongoing basis, making HowGood’s platform the leading-edge tool for product sustainability. In turn, HowGood is able to provide impact assessments that are always accurate, comprehensive, and the most up-to-date. Through the HowGood platform, we are able to scale this approach across products, brands, and the entire food industry.
HowGood
10 Gagnon Dr.
Stone Ridge
NY 12484
© 2024 HowGood.