HowGood is an independent research company and SaaS data platform with the world's largest database on food product sustainability. With more than 90,000 on-farm emissions factors for food ingredients, HowGood helps leading brands, retailers, suppliers and restaurants to measure, manage, and communicate their environmental and social impact.
Carbon Footprint Impact Label
A measure of the greenhouse gas emissions (GHGs) of a product, from Cradle-to-shelf
Who is HowGood?
HowGood is an independent research company with the world’s largest database on food product sustainability. With data and analysis for more than 33,000 ingredients, chemicals, and materials, HowGood helps leading food brands, retailers and investors improve their environmental and social impact. Through in-depth, ingredient-level insights on factors ranging from greenhouse gas emissions to animal welfare to labor risk, HowGood data powers strategic decision-making for the sourcing, manufacturing, merchandising, and marketing of sustainable products. Brands identify opportunities to improve sustainability, drive greater transparency, and empower their customers to make higher impact purchases. Visit howgood.com for more information.
What is HowGood's approach to research?
HowGood has more than 15 years of research on global food supply chains. The team consolidates and analyzes findings from over 600 accredited data sources and certifications. These include a range of resources such as international frameworks, NGO guidance and standards reports, peer reviewed life cycle assessment studies, journal articles, academic conference proceedings and texts, aggregated commercial databases, targeted industry studies, NGO research, government publications, and news reports from reputable outlets. HowGood employs the most industry-recognized methodologies and incorporates the latest scientific research. Metrics and impact assessments are updated on an ongoing, iterative basis, making HowGood’s platform the leading-edge tool for product sustainability. In turn, HowGood is able to provide impact assessments that are accurate, comprehensive, and the most up-to-date. Through HowGood’s sustainability intelligence platform, Latis, we are able to scale this approach across products, brands, and the entire food industry.
What is HowGood's Carbon Footprint impact label?
HowGood’s Carbon Footprint impact label is a measure of the greenhouse gas emissions (GHGs) of a product, from Cradle-to-shelf. It communicates the carbon footprint of a product by quantifying the GHG emissions generated in kilograms of carbon dioxide equivalent per kilogram of product (kg CO2e / kg). HowGood’s carbon footprint assessments are built on the world’s largest food product sustainability database, with granular emissions factors on more than 33,000 ingredients in the food system.
Calculation of the Carbon Footprint impact label includes all applicable stages of the product life cycle from agricultural production to retail shelf, including ingredient processing, manufacturing, storage, distribution and retail.
What is HowGood’s research methodology for calculating carbon emissions?
HowGood’s methodology for calculating GHG emissions is developed in accordance with the GHG Protocol.
1. Data Collection
HowGood draws on a diverse collection of data sources, including peer reviewed journal articles to calculate the CO2e values for ingredients. For each data source, HowGood performs a data certainty assessment based on the age and comprehensiveness of the findings. This process is completed for every ingredient on which there is accurate and verifiable data. For GHG emissions, HowGood relies on the International Panel on Climate Change (IPCC) 2013 global warming potential 100 year estimates where available and crop-specific LCAs.
2. Ingredient Mapping
Once the data is collected and analyzed, HowGood conducts a proprietary process of mapping each ingredient to its source crop, animal or material. Using global import/export data and HowGood industry partnerships, HowGood then maps each source crop to its corresponding geographic location to account for the specific on-the-ground practices, impacts, and risks in each locale.
3. Data Aggregation
HowGood, to date, has mapped nearly every ingredient, chemical and material (33,000 in total) in the CPG industry, including where and how it is produced. This mapping is used to aggregate data across geographic regions or ingredient categories and develop industry-average impact profiles for CO2e across every ingredient.
Based on the ingredient mapping process, HowGood assigns a default location and corresponding industry-average profile for every ingredient in a product. If deeper levels of data granularity are available (from a specific supplier, industry partner, or publication), these specifics are applied.
What data sources does HowGood use to assess GHG emissions?
For GHG emissions, HowGood relies on the International Panel on Climate Change (IPCC) 2013 global warming potential estimates where available and crop-specific LCAs. For crops and locations where no current data exists, HowGood uses relevant LCAs from proxy locations where farming methods are deemed as similar (ie. places that have the same fertilizer requirements, same size farm, etc).
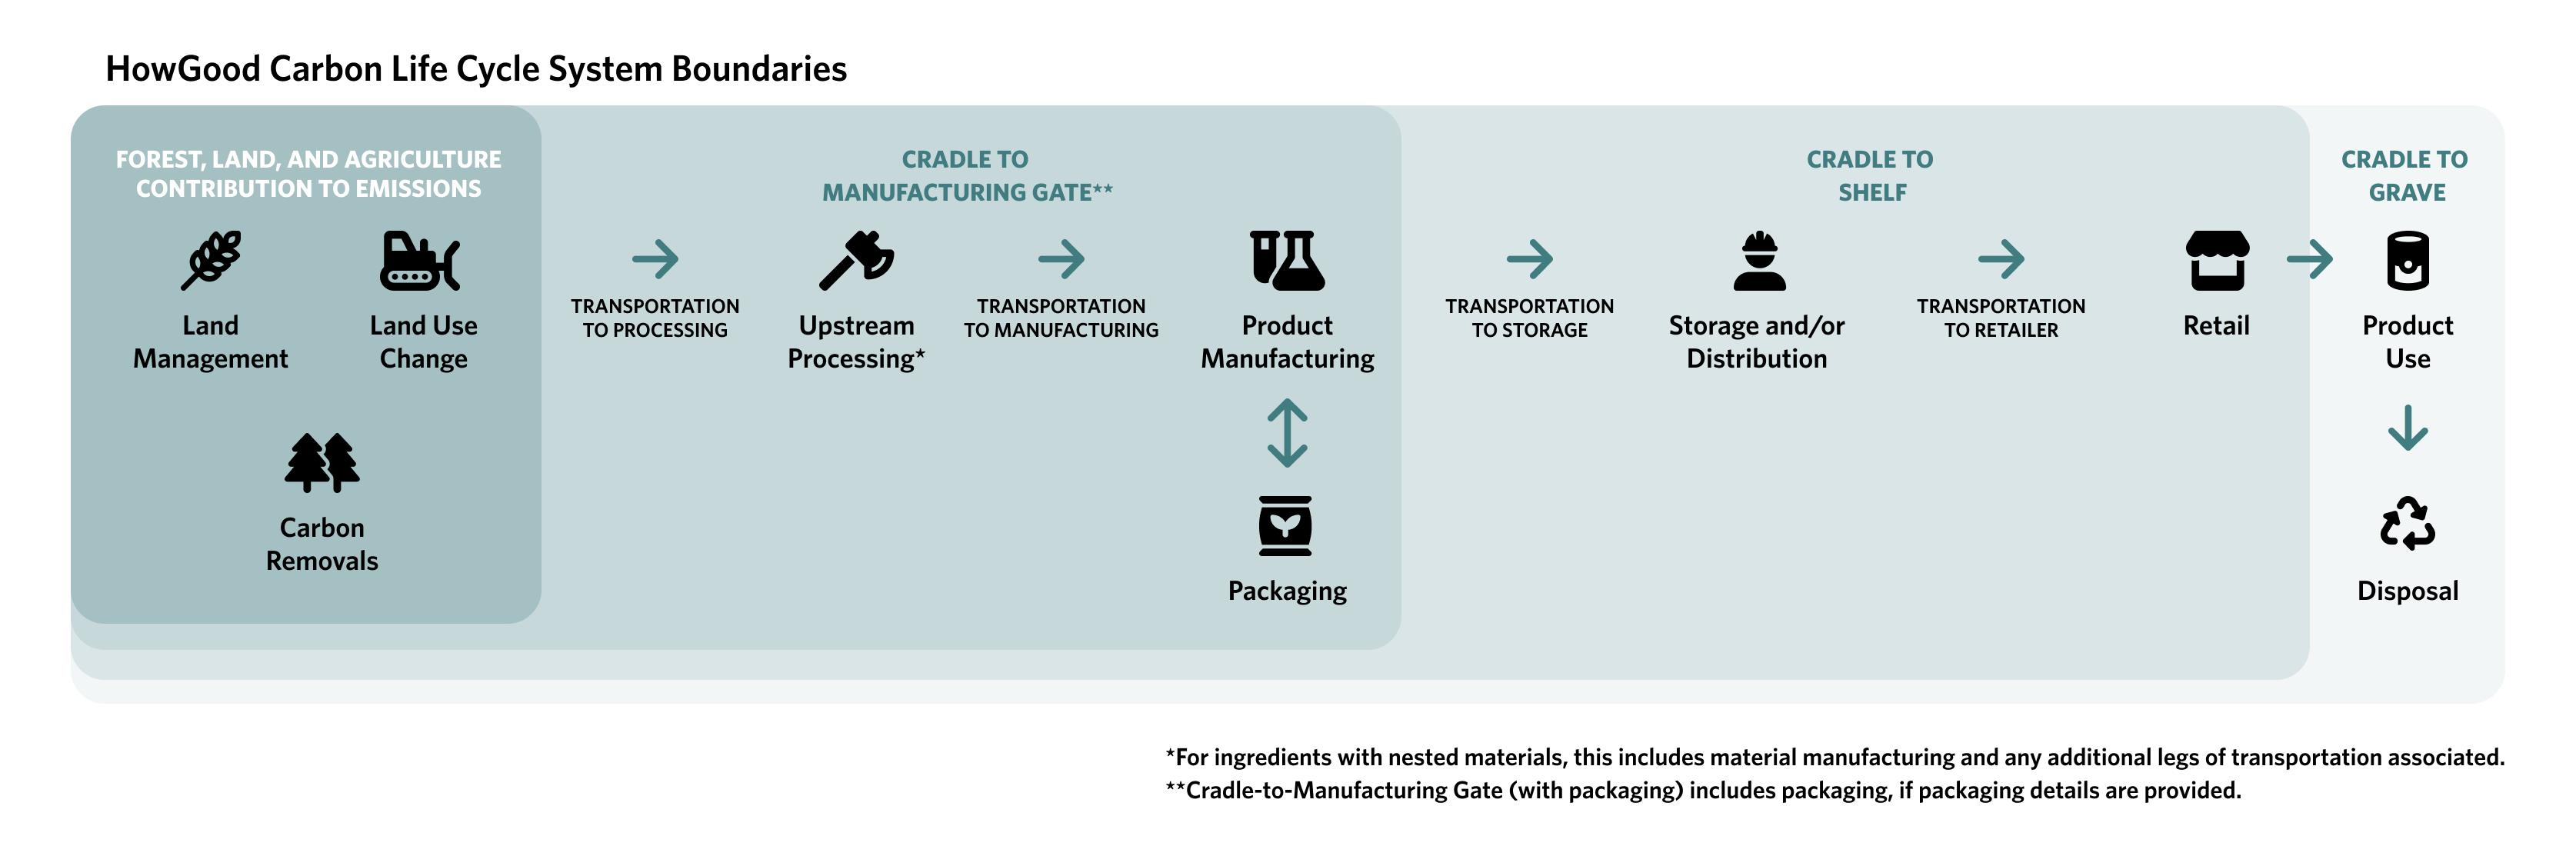
How does HowGood calculate carbon emissions at each stage of the carbon life cycle?
HowGood calculates carbon emissions at each stage of the carbon life cycle, defined in the framework detailed below:
No additional GHGs are included in the inventory. Weighting factors for delayed emissions, aircraft emissions, offsets and avoided emissions are not included in the inventory results.
Farm-to-Farm Gate
This stage covers GHG emissions due to the growing and harvesting of the material used to create an individual ingredient in a product. The material could be a crop, animal, mineral, or petroleum product. You will find this section is longer and more detailed than the others – this is because most of the emissions for food products comes from the farm. Because of this, our research team has prioritized detailed accounting methods for this stage of the product’s lifecycle.
Relevant Data Provided by Customers
- Ingredient
- Ingredient Weight
- Crop Sourcing Location
Relevant Data Used in Calculation(s)
- On Farm GHGs from LCAs
- Ingredient Concentration
HowGood asks the customer to provide a source location for the crop to provide the data. If the customer does not know the location where the crop was grown, HowGood uses a proxy for where the crop would be grown.
GHG impact is calculated as kilograms of CO2 equivalent per kilogram of the primary commodity ingredient (kg CO2e/kg) before any factory or processing emissions (Cradle-to-Farm Gate). On-farm processing, cooling or fermentation, and off-farm cleaning and sorting are included, when relevant to the production of that crop. GHGs are collected at farm gate, which includes all on-farm processes including primary inputs like fertilizer, pesticides, herbicides, and farm machinery fuel needs. Manufacturing of equipment, removals, and land use change are excluded from this value. Waste is also excluded as it is rarely specified in the literature. Biogenic emissions and removals are assumed to be neutral for crops. Some biogenic emissions are included for animals.
Identifying sources for on-farm GHGs
Measurements are directly sourced from location and crop-specific Life Cycle Assessments (LCAs) from all over the world as well as environmental assessments. Some frequent journals we consult are: International Journal of Life Cycle Assessment, Journal of Sustainable Energy & Environment, Journal of CleanerProduction, Carbon Management (TandFonline), Agricultural Systems (elsevier), Sustainability (MDPI). When searching for the on farm GHGs for a crop and location, our research team prioritizes ISO 14044 LCAs from peer reviewed journals, which use geographically relevant data inventories. We also prefer studies to be within the past 5 years. These conditions cannot always be met but we use the most accurate and reliable data we have at the time and frequently update our database when better data becomes available.
Consistent with the GHG Protocol, carbon sequestration is not included at this time. If a supplier can provide specific soil measurements meeting the GHG Protocol requirements for removals, then sequestration (removals) can be included in a separate, future metric.
HowGood Origin Location Proxy Identification Process
There is not enough research done on the emissions from producing crops and animals outside of the main commodities and conventional methods. Because of this, we sometimes need to choose a proxy value if we can’t find a paper that covers the specific material and location for which we are searching. Our decision process around finding proxy values is below.
Whenever a cradle-to-farm gate GHG value for an origin location is not available both in primary (e.g., LCA study) and secondary (e.g., collection of carbon footprint values) sources, a proxy value is necessary. In this case we use an internal proxying protocol to identify the most appropriate comparable data.
OPTION 1:
Our first option in selecting a proxy value is to look for an origin in a similar taxonomy (at least family, preferably genus or order); with similar crop type, yield, and agricultural management practices; and, in the same location or climatic/ecological region.
OPTION 2:
If an origin in a similar taxonomy, with comparable yield and in the same region cannot be found, we look for a similar product (e.g., similar botanical characteristics or same crop category) for the same location (preferable) or same climatic region.
OPTION 3:
Selecting a proxy value for the same product from a location belonging to a different region is our last option. When taking this route, we ensure that the original source has high quality data.
When choosing a proxy value, we always ensure that:
- The System Boundary is correct: (“cradle to farm gate”)
- The functional unit is kg CO2e/kg. We also specify whether it is fresh or dry weight (whenever this information is known)
- The production system is the conventional/dominant one for the origin location
Ingredient Concentration:
One of the more complicated parts of GHG accounting across the entire food system is assessing the amount of raw material to allocate to a single ingredient produced. There are many different allocation methods using mass, value, or a combination of the two. HowGood uses a value and mass-based approach when it comes to allocation. We assess the value of the co- and by-products produced along with the weights of the final output and required raw inputs. This final value gives us our ingredient concentration. We also allow customers to input their primary data of how much raw material is required to create a final ingredient and use this value in other products. Our research team has assessed and created commodity trees across our 33,000+ ingredients to capture this raw material input to more accurately reflect the on farm emissions of an ingredient.
Our final on-farm GHGs for an ingredient have the concentration value built into the final value our customers see in Latis.
EXAMPLE: It takes almost 7 times as much raw sugar cane to produce an equivalent amount of processed granulated sugar. So, our on-farm value for the raw sugar cane will be almost 7 times as high for the ingredient of granulated cane sugar.
Transportation to Processing
This stage covers the emissions due to transportation between the farm and ingredient processing locations. It also includes all transportation involved in pre-processing or manufacturing of inputs used in the final product, up to the final transportation to the manufacturing facility. This is relevant for complex products that contain nested or component products with intermediate transportation and manufacturing stages of the product lifecycle.
Relevant Data Provided by Customers
- Ingredient
- Ingredient Weight
- Crop Sourcing Location
- Processing Location
Relevant Data Used in Calculation(s)
- Distance between locations (300+ regions creating approximately 45,000 routes between them)
- Mode of transportation (8 modes of transportation, each with 3 emissions factors)
- Refrigeration requirements of the commodity (none, refrigerated, or frozen)
- Ingredient concentration
To create this metric, we multiply the weight-distance traveled by the emissions factor of the mode of transportation used. We use the 2019 Global Logistics Emissions Council (GLEC) standard, a GHG Protocol approved industry source for global transport emissions, as our source for emissions factors. Emissions factors are based on tonne-kilometers converted to kg-kilometers to normalize against 1 kg of product maintained in the HowGood database. HowGood customers don’t always have visibility into the methods and distances of transportation between the farm and processing location so HowGood uses proxy data in line with specification from the GHG Protocol.
Transportation distances are calculated using arc distance calculations between state, country, or region centroids. For the United States (where most HowGood clients are located) distances traveled within the same state are set at half the distance across the average sized state. When the farm and processing locations are both within the United States, half the distance across the country is used. Backhauling is not included.
Transportation within North America is assumed to be via truck. Transportation between countries outside of the United States is assumed to be via ship.
All transportation stages of the life cycle follow the above methodology, with the exception of this stage between farm and ingredient processing, which is the only transportation stage with ingredient concentration applied. If you are transporting X ton of corn to produce 1 ton of high fructose corn syrup, this stage multiplies the per kg transport emissions by X to reflect the amount of raw material transported.
As our clients and knowledge grows, HowGood updates this proxy data using more detailed modes, including regional data outside of the US. In addition, we plan to accept primary data from customers regarding exact locations of facilities with more exact distances and modes of transportation included.
UPSTREAM Processing
Upstream Processing is an assessment of the energy it takes for the factory processing needs of a given ingredient and the likely fuel(s) needed for that process. Some ingredients are highly processed and require considerable energy to convert them from raw source material into a product that is ready for market. This stage also includes the manufacturing of nested products used as ingredients within a more complex, final product (hereafter referred to as “materials”).
Relevant Data Provided by Customers
- Ingredient
- Ingredient Weight
- Processing Location
Relevant Data Used in Calculation(s)
- Processing type energy requirements by fuel (100+processing types)
- Grid mix at processing facility (calculated across 300+ regions)
- Fuel type emissions factors (7 fuel types)
Ingredients are assessed for energy requirements of processing after they arrive at the factory and before combination into final products. For example, wheat flour would have all stages of milling’s energy requirements assessed. That would include washing, grinding, sorting, and sifting, and bleaching when applicable. Excluded from this energy value are overhead operations, employee transportation, and manufacturing of the equipment. HowGood then uses the grid mix at the processing location to calculate the associated emissions due to the ingredient processing.
In many cases, as it is with some extracts, or supplements, multiple parts of the processing have been accounted for where industry standards can be applied (ex: for safflower extract applies alcohol solvent extraction/spray drying process). We account for each part of the processing where that information is provided or where we can safely make standard processing assumptions. Where this information is not available or assumptions cannot be safely made, and an ingredient has multiple processing types associated, the most energy intensive processing type is used.
Many times customers do not have insights into where their ingredients are processed. In this case, the location of the processing facility in relation to the farm location is determined by specific research on the nature of the crop, economic considerations, and processing specialization. Most crops are processed on or near the farm where they are grown. In this case, the same location as the farm will be chosen. There are a few specialty crops which tend to be processed away from the farm in specific regions. HowGood assesses which crops fall into this category by analyzing trade data and checking EcoInvent for references, where available.
We use region grid mix values to determine how much kg CO2e is emitted per unit of energy when the likely fuel to be used in a process is electricity. We have these grid mix values for US states and most countries and are still developing methodology to calculate them for other compound regions (sub-national and supra-national). For fuel types other than electricity (e.g. direct burning of natural gas, coal, biomass etc), we use the carbon intensity of the applicable fuel. This enables our tool to give biogenic CO2 emissions data required by many disclosure bodies as a separate metric. Biogenic emissions are not included in this value.
Transportation to Manufacturing
This stage covers the emissions due to upstream transportation of all materials to the final manufacturing facility.
Relevant Data Provided by Customers
- Ingredient
- Ingredient Weight
- Manufacturing Location
Relevant Data Used in Calculation(s)
- Distance between locations (300+ regions creating approximately 45,000 routes between them)
- Mode of transportation (8 modes of transportation, each with 3 emissions factors)
See Transportation to Processing for details.
Product Manufacturing
Manufacturing is an assessment of the energy it takes for the factory manufacturing needs of a given product.
Relevant Data Provided by Customers
- Manufacturing Type
- Manufacturing Location
Relevant Data Used in Calculation(s)
- Energy required by Manufacturing Type (80+ manufacturing types)
- Grid mix at Manufacturing Location (calculated across 300+ regions)
- Fuel type emissions factors (7 fuel types)
To calculate GHGs associated with product manufacturing, HowGood uses the product type/sales category and location of the manufacturing facility. Products are grouped into categories based on similar manufacturing processes. Customers can choose the manufacturing type which best describes their product, or HowGood can make a reasonable assumption based on the sales category.
The energy needs of each process or subprocess associated with the production line is collected/estimated from energy or environmental assessments and life cycle inventories as MJ/kg product per fuel type. They can include refrigeration and lighting but exclude overhead operations, employee transportation, and manufacturing of the equipment. We base our estimates on the manufacturing category of the product (frozen entree, cold case milk, chips & snacks, juice beverages, etc). For example, the manufacturing energy required to make yogurt or kefir would include mixing of ingredients (fruit, etc), culture/fermentation process, sterilization of equipment, sterilization of jar/vessel, heat sealing process, and refrigeration.
HowGood then uses the total energy consumption and the carbon intensity of electricity at the manufacturing location and/or emissions factors of the other fuels to calculate the associated emissions due to the product manufacturing.
When customers have conducted product LCAs and can provide manufacturing energy data with enough granularity to map to our inclusions and exclusions, we can ingest that data and create a customer and product(s) specific manufacturing type.
Waste is excluded from manufacturing by default, however customers can input their ingredient data as the amount of ingredient needed to produce 100 kg of product to account for waste if they wish. See Impact accounting for products where ingredients outweigh the final product for more information on how to do this.
See the last paragraph in Upstream Processing for limitations and planned changes.
Product Packaging
HowGood requests the specifics of each layer of packaging as well as the recycled content of the materials. The weight of the material, the number of times the packaging can be re-used, and the number of consumer units within the packaging layer all contribute to the final packaging emissions.
Relevant Data Provided by Customers
- Packaging weight
- Consumer units
- Number of uses
Relevant Data Used in Calculation(s)
- Manufacturing region
- Packaging material energy requirements by fuel (40+ packaging materials)
- Net weight of product
- Weight of packaging
Packaging material energies capture the energy requirements and likely fuels from extraction through production. Transportation of packaging materials to the manufacturing location and waste are excluded at this time. Biogenic emissions are not included in this metric.
Transportation from Manufacturing to Storage (Optional)
For those products that will travel to a warehouse or distribution center between being manufactured and going to retail shelves, we account for emissions due to transportation between the manufacturing facility and the storage facility.
Relevant Data Provided by Customers
- Manufacturing Location
- Warehouse Location
Relevant Data Used in Calculation(s)
- Distance between locations (300+ regions creating approximately 45,000 routes between them)
- Mode of transportation (8 modes of transportation, each with 3 emissions factors)
- Refrigeration requirements of the product
See Transportation from Farm to Processing Facility for details.
Storage/Distribution Center (Optional)
Keeping products in a storage or distribution location prior to retail impacts a product’s total emissions.
Relevant Data Provided by Customers
- Warehouse Location
- Product Cold Storage Requirements
Relevant Data Used in Calculation(s)
- Grid Mix at Warehouse Location (calculated across 300+ regions)
- Warehouse Cold Storage Energy (constants)
We are including cold storage emissions and excluding emissions related to other overhead costs at the distribution center or storage facility. HowGood recognizes that a product may have many storage or distribution centers. However, since our final unit is kg CO2e/kg final product, we ask customers to choose a single location that best represents their data, and we ask if their product requires refrigeration.
Storage is assumed to be 30 days for refrigerated products and the storage time for frozen products was unspecified in the source.
Transportation to Retailer
This stage covers the emissions attributed to a product being transported to the retailer. If a product has spent time at a distribution or warehouse facility, the starting point for this journey is considered to be the location of said center. If not, we assume the product has traveled directly from the manufacturer to the retailer.
Relevant Data Provided by Customers
- Manufacturing Location OR Warehouse Location
- Retail Location
- Product Cold Storage Requirements
Relevant Data Used in Calculation(s)
- Distance between locations (300+ regions creating approximately 45,000 routes between them)
- Mode of transportation (8 modes of transportation, each with 3 emissions factors)
See Transportation from Farm to Processing Facility for details.
RETAILER
A product’s next stage is to go to the retailer to be purchased by the user.
Relevant Data Provided by Customers
- Retail Location
- Product Cold Storage Requirements
Relevant Data Used in Calculation(s)
- Grid Mix at Retail Location (calculated across 300+ regions)
- Retailer Cold Storage Energy (constants)
A significant amount of emissions at this stage are due to refrigerants and energy required for cold storage. Other emissions at the retailer are due to overhead operations which we have excluded from our analysis, consistent with the GHG protocol methodology. For this reason, in line with the GHG Protocol, we utilize only the energy required for cold storage at the retailer stage. This energy is combined with the average grid mix of the retailer location to calculate the final emissions at this stage. HowGood recognizes that retailers are rarely in a single location. However, since our final unit is kg CO2e/kg final product, we ask customers to choose a single region that best covers the area where a product is sold. Out of scope for this analysis is the emissions due to a customer traveling to and from the retailer. Waste at the retailer is also excluded.
The emissions for refrigerated or frozen storage at the retailer was taken as an average value for meat and vegetables. We assume an average storage time of 30 hours for chilled products and 96 hours for frozen products.
HowGood
10 Gagnon Dr.
Stone Ridge
NY 12484
© 2024 HowGood.